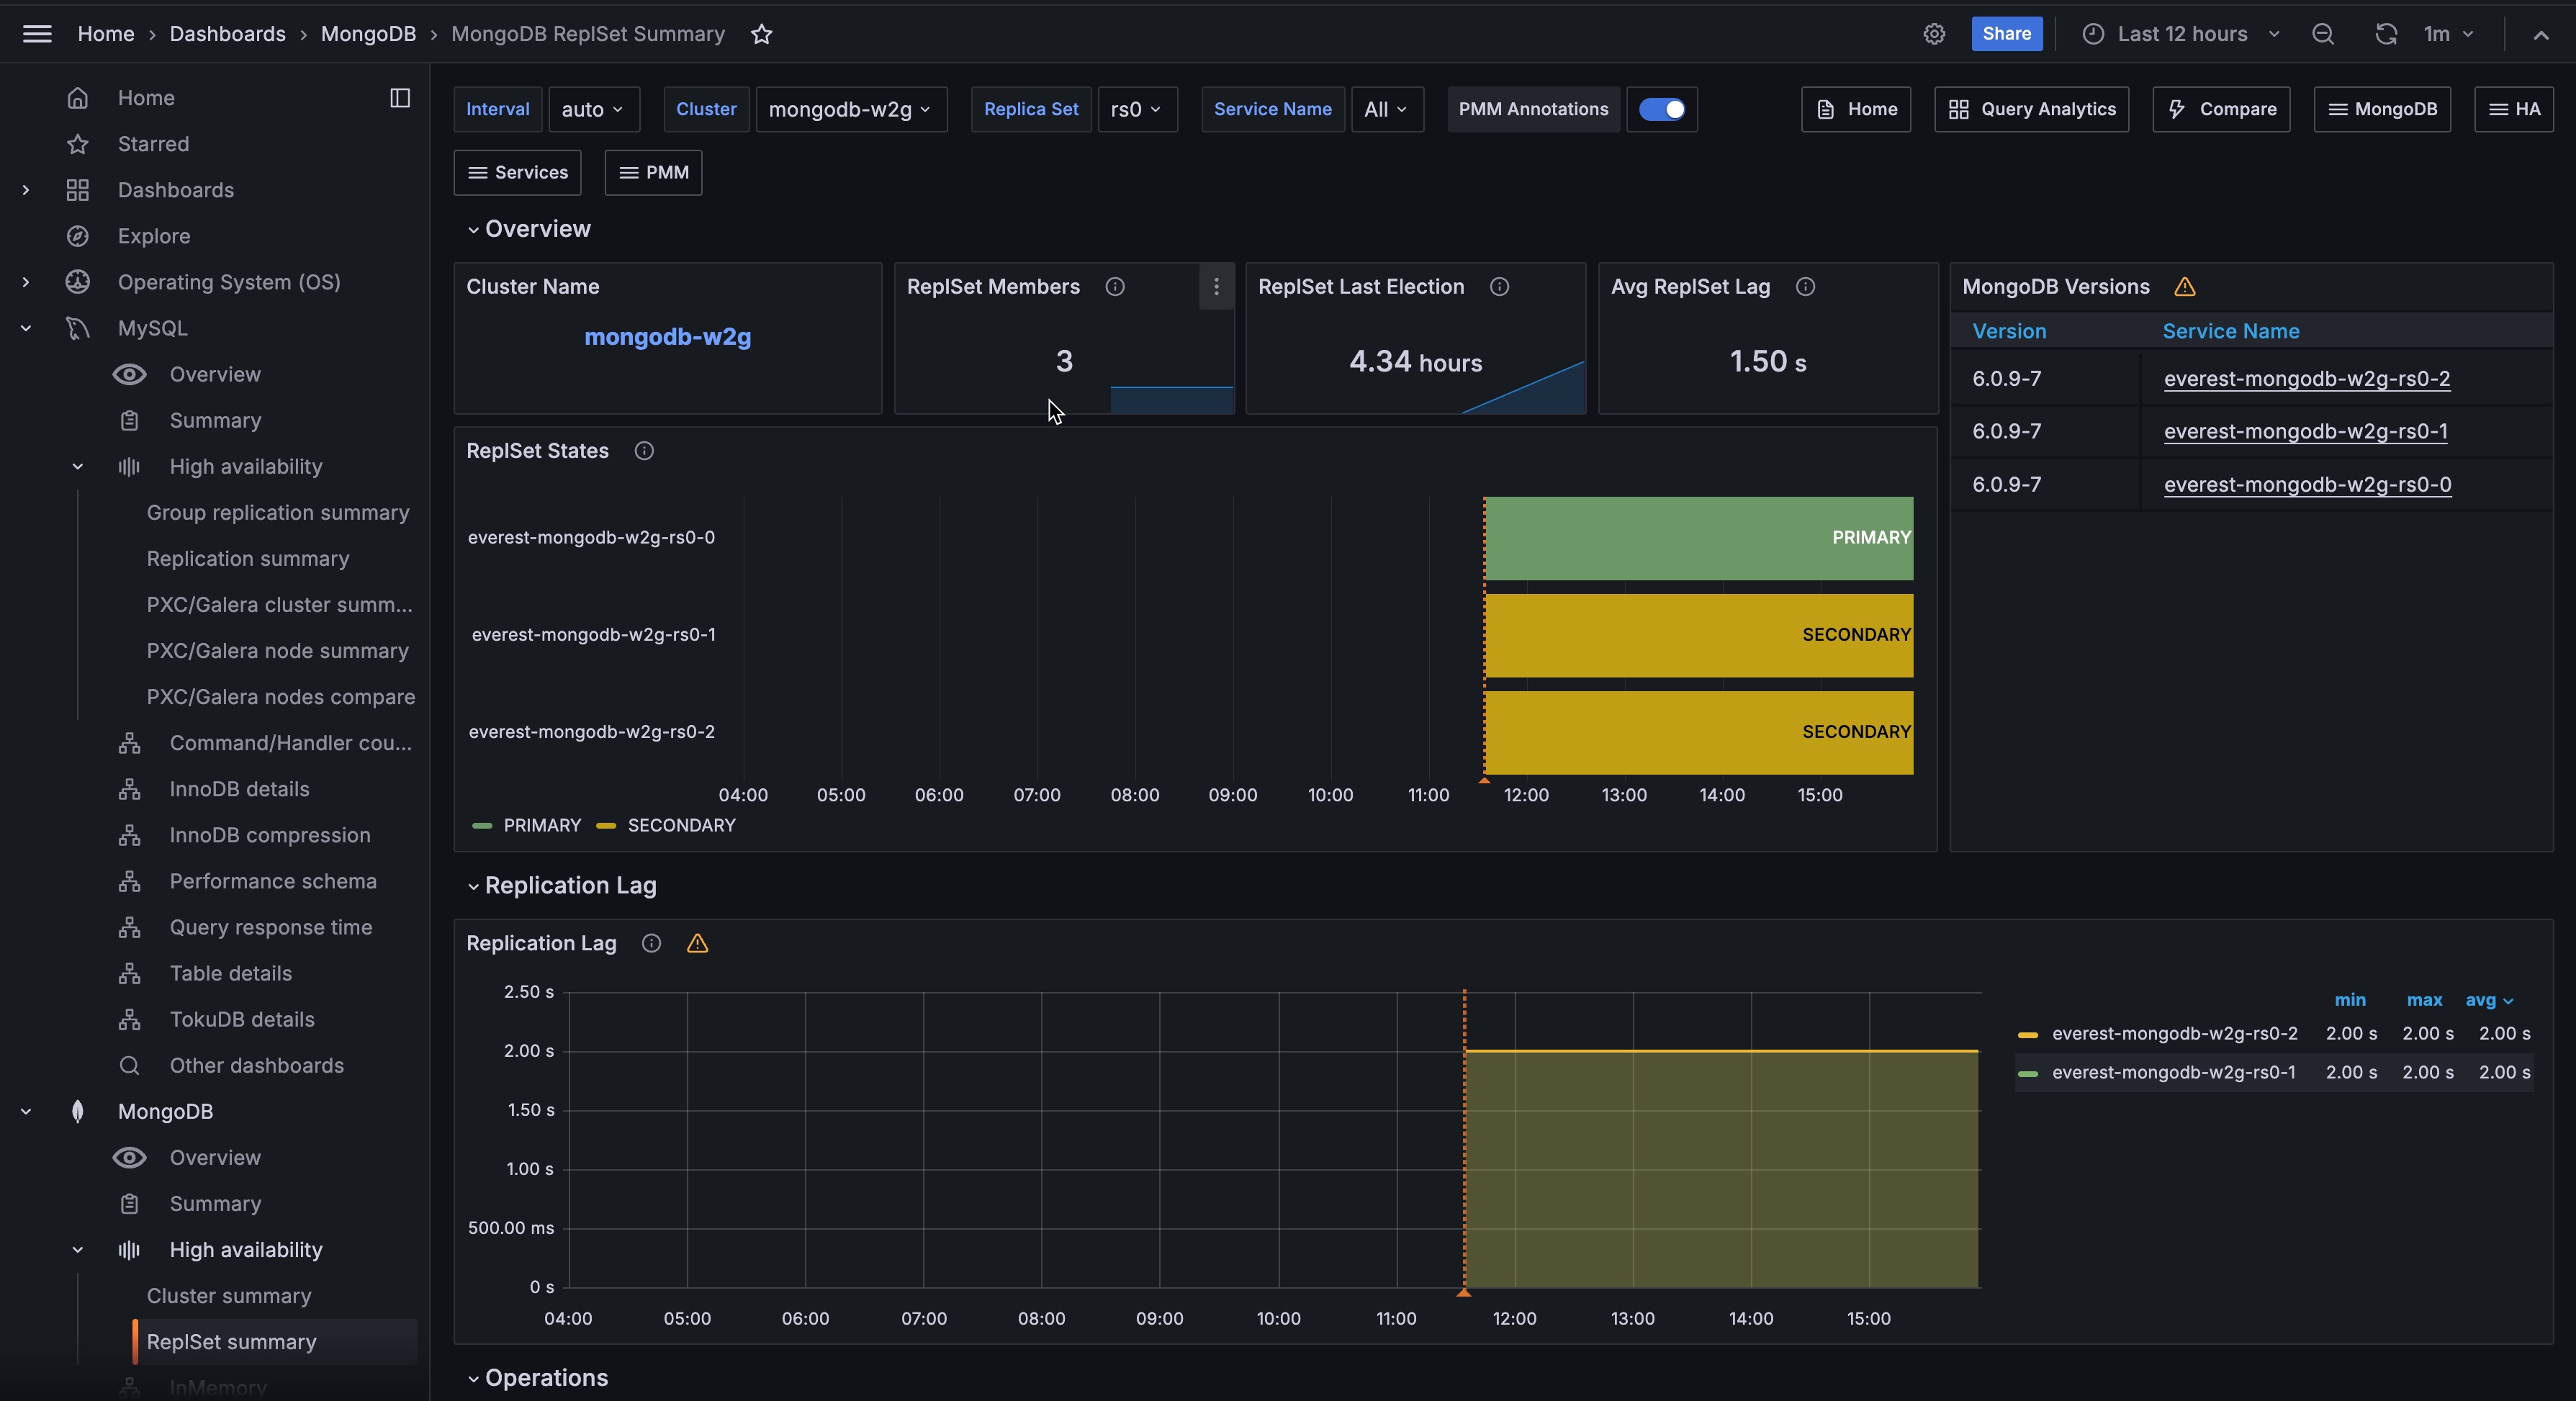
MongoDB ReplSet Summary

Overview
Displays essential data for individual nodes, such as their role, CPU usage, memory consumption, disk space, network traffic, uptime, and the current MongoDB version.
Node States
Shows the state timeline of MongoDB replica set members during the selected time range. Each node’s state (PRIMARY, SECONDARY, ARBITER, etc.) is color-coded for easy monitoring, with green indicating healthy states and red showing potential issues. Use this to track role changes and identify stability problems across your replica set.
Details
Command Operations
Shows the rate of MongoDB operations per second, including both regular and replicated operations (query, insert, update, delete, getmore), as well as document deletions by TTL indexes. Use this metric to monitor database activity patterns and identify potential performance bottlenecks.
Top Hottest Collections by Read
Shows the five MongoDB collections with the highest read operations per second. Use this to identify your most frequently accessed collections and optimize their performance.
Top Hottest Collections by Write
Shows the five MongoDB collections with the highest write operations (inserts, updates, and deletes) per second. Use this to identify your most frequently modified collections and optimize their write performance.
Query Efficiency
Shows the ratio of documents or index entries scanned versus documents returned. A ratio of 1 indicates optimal query performance where each scanned document matches the query criteria.
Higher values suggest less efficient queries that scan many documents to find matches. Use this to identify queries that might need index optimization.
Queued Operations
Shows the number of operations waiting because the database is busy with other operations. Use this to identify when MongoDB operations are being delayed due to resource conflicts.
Reads & Writes
Shows both active and queued read/write operations in your MongoDB deployment. Use this to monitor database activity and identify when operations are being delayed due to high load.
Connections
Shows the number of current and available MongoDB connections. Use this to monitor connection usage and ensure your deployment has sufficient capacity for new client connections.
Query Execution Times
Shows the average latency in microseconds (µs) for read, write, and command operations. Use this metric to monitor query performance and identify slow operations that may need optimization.
Collection Details
Size of Collections
Shows storage size of MongoDB collections across different databases. Use this to monitor database growth and plan storage capacity needs.
Number of Collections
Shows the total number of collections in each MongoDB database. Use this to track database organization and growth patterns.
Replication
Replication Lag
Shows how many seconds Secondary nodes are behind the Primary in replicating data. Higher values indicate potential issues with network latency or system resources. The red threshold line at 10 seconds helps identify when lag requires attention.
Oplog Recovery Window
Shows the time range (in seconds) between the newest and oldest operations in the oplog. Use this to ensure sufficient history is maintained for recovery and secondary synchronization.
Oplog GB/Hour
Shows hourly data volume written to cache from the MongoDB oplog by the Primary server. Use this to track oplog growth, plan storage needs, and detect high-write periods. Values are displayed in bytes with hourly intervals.
Performance
Flow Control
Shows the frequency and duration (in microseconds) of MongoDB write throttling. Use this to understand when your deployment is slowing down writes to keep replication lag under control.
WiredTiger Concurrency Tickets Available
Shows how many more read and write operations your MongoDB deployment can handle simultaneously. Use this to monitor database concurrency limits and potential bottlenecks.
Nodes Summary
Nodes Overview
Shows key system metrics for each node: uptime, load average, memory usage, disk space, and more. Use this table to monitor the health and resource utilization of your infrastructure at a glance.
CPU Usage
Shows CPU utilization as a percentage of total capacity, broken down by user and system activity. Use this to monitor CPU load and identify potential performance bottlenecks.
CPU Saturation
CPU Saturation and Max Core Usage
Shows how heavily your CPU is loaded with waiting processes and maximum core utilization. Use this to identify when your system needs more CPU capacity or when processes are competing for CPU time.
Disk I/O and Swap Activity
Monitors disk input/output operations and memory swap activity across Kubernetes nodes, providing insights into data flow between storage, RAM, and swap space. Use this to detect performance bottlenecks, identify memory pressure, and optimize overall system resource utilization.
Network Traffic
Monitors inbound and outbound network traffic across Kubernetes nodes, providing visibility into data flow and network performance. Use this to track bandwidth usage, identify traffic patterns, and detect potential network congestion or communication bottlenecks.
Get expert help
If you need assistance, visit the community forum for comprehensive and free database knowledge, or contact our Percona Database Experts for professional support and services.